


Do you need another report? Contact us to discuss your need. We help with custom report types and can also support you in writing a report.


The consensus map allows you to compare opinions of different stakeholder groups.
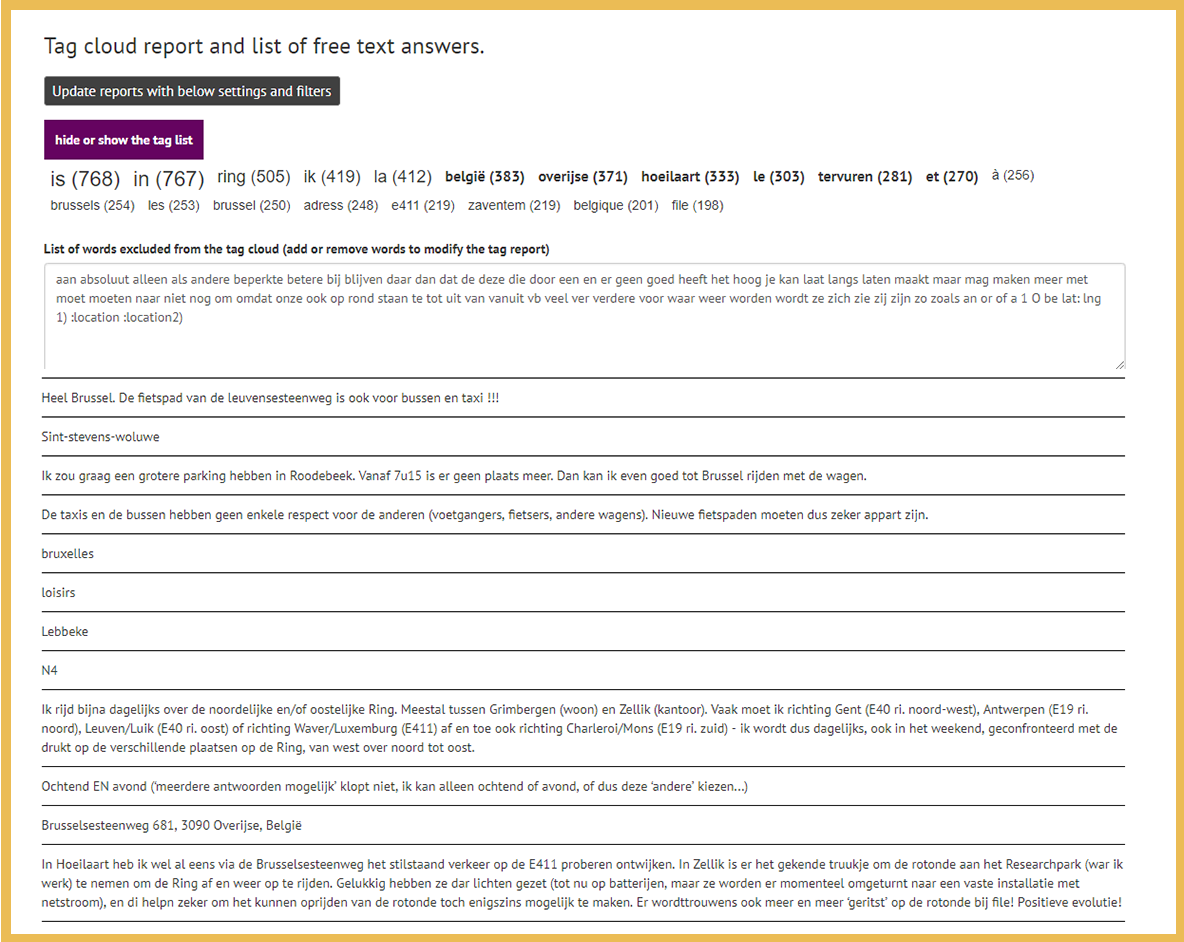

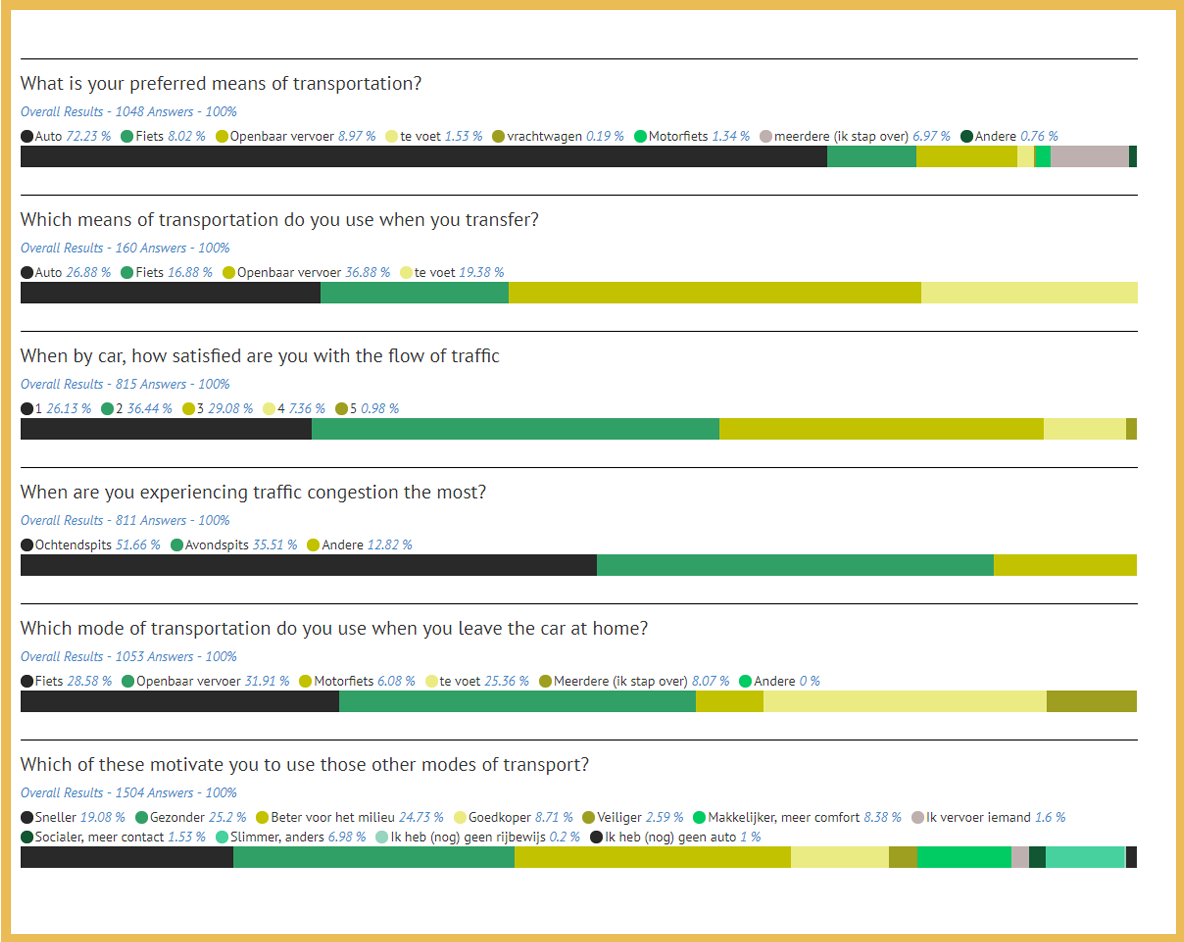
You can make word clouds, search for text strings or filter answers by stakeholder group.
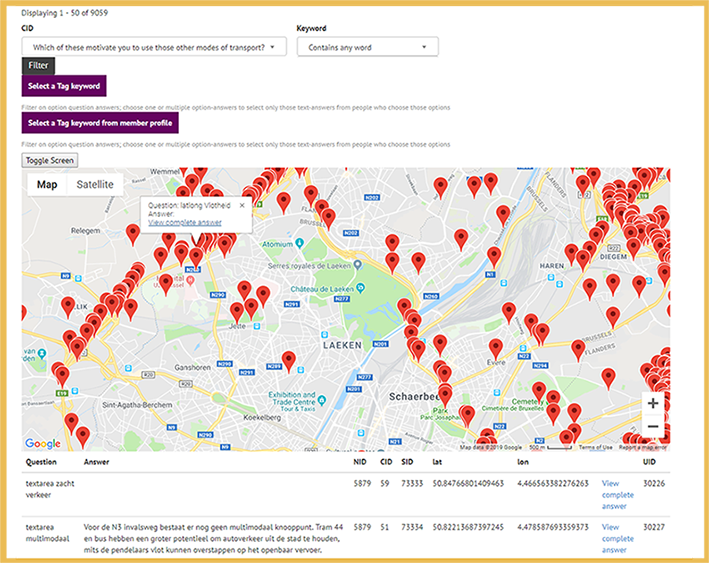

Visualise comments and images on a map, search for text strings on a map, filter by points added by a stakeholder profile
Do you need another report? Contact us to discuss your need. We help with custom report types and can also support you in writing a report.